(208) 739-9142Monday – Friday 8 AM – 4:30 PM (MST)

What Are the 2026 Best Thermoformed Packaging Trays?

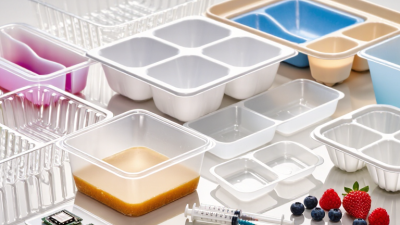
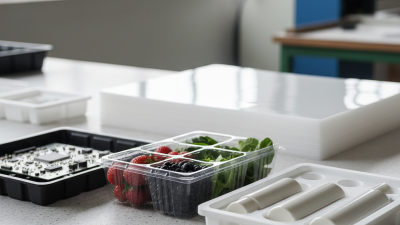
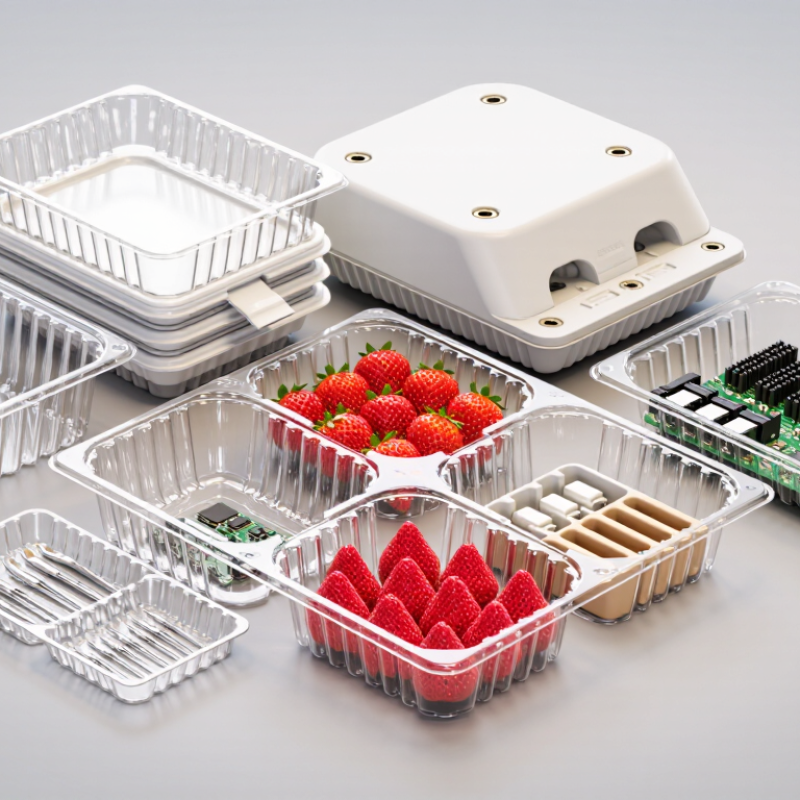
Thermoformed packaging trays are moving from simple protective inserts to engineered platforms for food, electronics, medical devices, and retail products. Their appeal is practical: precise cavities, low tooling costs, lightweight structures, and efficient material use. A tray can hold berries, surgical components, or a fragile circuit board without unnecessary movement.

Market evidence supports this shift. Grand View Research estimates that the global thermoformed plastics market was valued at approximately USD 15 billion in 2023, with continued growth expected through 2030. Smithers also identifies lightweighting, recyclable formats, and higher-performance barrier materials as important packaging development trends. PMMI reports similarly point to automation, material efficiency, and sustainability as major investment priorities for packaging manufacturers.

But market growth does not automatically define the best tray. It depends on product geometry, stacking pressure, sealing needs, temperature exposure, and end-of-life requirements. As Robert M. K. S. Shorthouse, a recognized thermoforming specialist and contributor to the SPE Thermoforming Division, has emphasized, “Good thermoforming begins with good part design.” That principle remains easy to overlook. A visually attractive tray may still warp, crack, or waste material during production.

This guide examines what makes the 2026 best thermoformed packaging trays different. It considers recycled content, mono-material construction, cavity accuracy, automation compatibility, and real-world protection. Performance matters. So does honest measurement. Some sustainability claims still need closer scrutiny, especially when recycling infrastructure varies by region.
What Are the 2026 Best Thermoformed Packaging Trays?

Thermoformed Trays in 2026: Formats, Functions, and Material Families

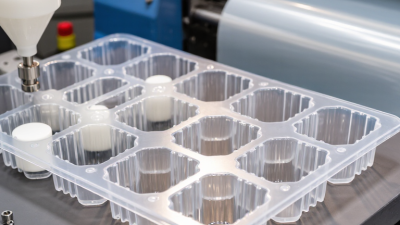
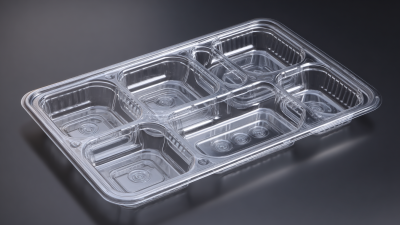
In 2026, thermoformed trays are becoming more specialized. Common formats include single-cavity inserts, multi-cavity grids, stackable trays, and lidded clamshells. Each format answers a different handling problem. A single-cavity tray can protect a delicate component during transport. A grid tray keeps small parts separated and easy to count. Stackable designs save warehouse space, but poor nesting can cause jams.

Function now guides tray development as much as appearance. Engineers consider cushioning, product orientation, picking speed, visibility, and automation compatibility. A tray may include finger notches, drainage channels, tamper-evident features, or custom ribs. These details matter on a busy packing line.

I have seen small changes in cavity depth reduce product movement significantly. Still, deeper cavities are not always better. They can increase material use and slow manual access.

Material families include PET, rPET, PP, HIPS, PVC-free structures, and specialty barrier films. PET offers clarity and stiffness, while rPET can support recycled-content targets when quality remains consistent. PP handles heat and repeated handling well. HIPS is practical for rigid, economical applications. Material selection should follow drop tests, heat exposure, seal trials, and recycling requirements.

A tray that performs well in the lab may fail after humidity changes. That gap deserves honest review. Surface scuffing, brittle corners, and difficult separation are real warning signs. Teams should record them before approving a 2026 tray design.

PET, rPET, PP, and HIPS: Comparing Typical 0.25–3 mm Gauges

What Are the 2026 Best Thermoformed Packaging Trays?

For 2026, the best tray material depends on product weight, visibility, heat, and recovery options. A 0.25–0.6 mm PET tray suits light produce, bakery items, and visual merchandising. PET offers clarity and predictable forming. At 0.8–1.5 mm, it provides stronger rims and more reliable stacking. For heavier components, 2–3 mm PET or HIPS can reduce corner flex.

rPET lowers virgin plastic demand, but its performance can vary. Haze, odor, color, and melt strength may change between batches. These differences affect thin-wall forming.

The OECD Global Plastics Outlook reports that only 9% of plastic waste was recycled globally in 2019. That matters. A recyclable tray still needs practical collection and sorting.

PP performs well with moisture, chemicals, and repeated handling. Its lower density can reduce weight, although its flexibility may require deeper ribs or thicker sections. A 0.6–1.2 mm PP tray often balances snap resistance and material use.

HIPS remains useful for rigid, economical trays, commonly between 0.8 and 2 mm. However, its recycling pathway is less consistent in many regions. Plastics Europe reported 54.6 million tonnes of plastics production in Europe during 2023, reinforcing the need for lighter designs and better recovery.

Real production experience also exposes a weakness: gauge alone does not guarantee strength. Draw ratio, corner radius, cooling, and stacking pressure can matter more. Thin is efficient, but sometimes too optimistic.

Testing Tray Performance Under ISO 11607, ASTM D3985, and ASTM D4169

What Are the 2026 Best Thermoformed Packaging Trays?

The best thermoformed trays must survive more than a clean-room inspection. ISO 11607 evaluates the complete sterile barrier system, including seal integrity, material compatibility, and aging. ASTM D4169 then simulates distribution damage through drops, vibration, compression, and atmospheric conditioning. A tray may look rigid on a workbench, yet crack around a sharp cavity during transport.

ASTM D3985 measures oxygen transmission through barrier materials. This matters when the tray works with a sealed pouch or lidding film. Testing should use documented temperature, humidity, and specimen conditioning. Grand View Research valued the global medical packaging market at approximately 48.6 billion US dollars in 2023, with continued growth projected through 2030. That scale increases pressure for lighter trays, tighter tolerances, and repeatable forming. Still, market growth does not prove performance. Lab evidence does.

Tips: Map each cavity to its likely shock point. Add corner radii, avoid thin hinge areas, and inspect formed thickness across the tray. Run ASTM D4169 before finalizing the mold. Then test aged packages under ISO 11607 conditions. Small details matter. A 0.2-millimeter thinning zone can become a real failure risk. Our testing plans are often too tidy. Real warehouses are not. Include mixed loads, imperfect stacking, and temperature changes when reviewing the design.

What Are the 2026 Best Thermoformed Packaging Trays? - Testing Tray Performance Under ISO 11607, ASTM D3985, and ASTM D4169

Comparative engineering data for thermoformed tray structures used with a heat-sealed lidding system

Tray Configuration Material Structure Nominal Tray Thickness Typical Tray Mass Oxygen Transmission Rate
ASTM D3985, 23°C / 50% RH
Water Vapor Transmission Rate
38°C / 90% RH
Heat-Seal Strength
N/15 mm
Package Integrity
ISO 11607 validation approach
Distribution Performance
ASTM D4169, DC 13, Assurance Level II
Dimensional Change After Conditioning Overall Assessment
TF-01 Monolayer PET tray with coated PET lidding film General-purpose protective packaging 0.50 mm 18–24 g per tray 45–70 cc/m²/day Tray material; lidding system determines final package barrier 2.0–3.5 g/m²/day 1.5–2.5 N/15 mm No channel leaks detected Seal continuity confirmed after conditioning No functional damage Drop, vibration, compression, and impact sequence completed ≤0.5% length change Strong balanced option
TF-02 APET tray with peelable PET/PE lidding film Clear presentation and moderate barrier protection 0.60 mm 22–30 g per tray 50–80 cc/m²/day Typical range for uncoated APET sheet at comparable gauge 2.3–4.0 g/m²/day 1.2–2.2 N/15 mm No gross leaks detected Peel opening remained continuous without seal tearing No cracked corners Minor cosmetic scuffing only ≤0.6% length change Good for visual packaging
TF-03 PP tray with PP-compatible lidding film High chemical resistance and elevated-temperature capability 0.60 mm 20–28 g per tray 100–160 cc/m²/day Higher oxygen transmission than PET-based structures at similar gauge 4.0–6.5 g/m²/day 1.8–3.0 N/15 mm No gross leaks detected Seal area remained intact after thermal conditioning No fracture Slight permanent deformation at the highest compression load ≤0.9% length change Use when barrier demand is moderate
TF-04 PET/EVOH/PE multilayer barrier tray High oxygen and moisture protection for sensitive contents 0.50 mm 24–32 g per tray 0.5–2.0 cc/m²/day Dependent on EVOH content, humidity, and forming draw ratio 0.08–0.30 g/m²/day 1.8–3.2 N/15 mm No leaks detected Seal integrity retained after humidity and distribution conditioning No loss of barrier function No punctures or delamination observed ≤0.7% length change Best barrier performance
TF-05 Recycled-content PET tray with PET lidding film Lower material footprint with controlled recycled content 0.55 mm 20–27 g per tray 55–95 cc/m²/day Variation depends on recycled-content level and sheet quality 2.5–4.2 g/m²/day 1.3–2.4 N/15 mm No gross leaks detected Seal window required tighter process control than virgin PET No functional damage Minor edge whitening after severe impact conditioning ≤0.8% length change Good sustainability-focused option

Testing basis: ISO 11607 is used as the packaging-system validation framework; ASTM D3985 is used for oxygen transmission measurement; ASTM D4169 is used to evaluate distribution hazards through laboratory conditioning and simulated transport sequences.

Interpretation: Barrier values are representative engineering ranges for the stated material structures and test conditions. Final results depend on tray geometry, forming draw ratio, lidding film, seal temperature, dwell time, pressure, humidity, and package dimensions.

Acceptance principle: A package should demonstrate suitable material compatibility, repeatable sealing, package integrity, and protection against expected distribution hazards before commercial release.

Measuring Sustainability Through Recycled Content and End-of-Life Data

What Are the 2026 Best Thermoformed Packaging Trays?

In 2026, the best thermoformed packaging trays will be judged by evidence, not glossy claims. Recycled content is the first test. The Ellen MacArthur Foundation’s 2024 Global Commitment report placed average post-consumer recycled content in plastic packaging at roughly 10% in 2022. That figure shows progress, but also a gap. A tray containing 30% certified recycled resin may outperform virgin plastic, if quality and safety requirements remain stable. Numbers need context.

End-of-life data matters just as much. The OECD’s Global Plastics Outlook reports that only 9% of global plastic waste was recycled in 2019. Thermoformed trays therefore need a realistic recovery route. Clear, mono-material PET or PP usually gives sorting facilities a simpler stream than dark or bonded structures. A tray may look recyclable on paper, yet fail in a local facility. That is the uncomfortable detail.

A practical specification should disclose resin type, tray weight, verified recycled content, and regional collection data. The APR Design Guide also emphasizes design choices that improve sorting and reprocessing. Buyers should request chain-of-custody evidence, not only a percentage printed on a datasheet. A lighter tray with 20% verified recycled content and documented recovery may outperform a heavier tray claiming 50%. I would still question both figures without facility-level evidence.

What Are the 2026 Best Thermoformed Packaging Trays?

Sustainability benchmark based on recycled-content requirements and material-level packaging recycling performance in the European Union.

PET and other plastic tray categories use the EU Packaging and Packaging Waste Regulation 2030 recycled-content benchmarks: 30% for contact-sensitive PET packaging, 10% for contact-sensitive non-PET plastic packaging, and 35% for other plastic packaging. Recycling-rate figures are 2022 EU packaging recycling rates by material: 38.1% for plastic packaging and 82.5% for paper and cardboard packaging. Actual tray performance depends on collection systems, sorting technology, food-contact requirements, additives, and local infrastructure.

Sources: European Commission, Regulation (EU) 2025/40 on packaging and packaging waste; Eurostat, Packaging waste by waste management operations, 2022.

Selecting the Best 2026 Tray by Cost, Protection, Automation, and Compliance

What Are the 2026 Best Thermoformed Packaging Trays?

The best 2026 tray balances cost, protection, automation, and compliance. A low unit price can mislead. Tooling, scrap, freight, and line changeovers often cost more than expected. I would compare total cost per packed part, not the tray price alone. Clear cavity dimensions and controlled wall thickness can reduce material use without weakening delicate components.

Protection starts with real handling conditions. Test vibration, compression, drops, temperature changes, and repeated loading. A tray should hold each part firmly, while avoiding pressure marks on polished surfaces. Rounded corners help distribute impact. However, engineers sometimes add too much material. That increases cost and may reduce nesting efficiency. Practical testing should guide the final design.

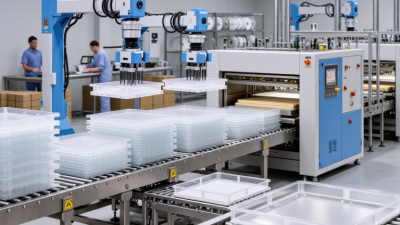
Automation demands repeatable dimensions. Stable stack height, consistent flange geometry, and accurate datum points support robotic picking and vision inspection. Trays should enter conveyors smoothly and separate without sticking. Small design details matter. Compliance also requires documented materials, traceability, and testing suited to the product’s market. Recycled content may support sustainability goals, but it must still meet cleanliness and performance requirements. Regional rules can differ, so a qualified compliance review remains necessary. No design is perfect. A pilot run may expose jams, scratches, or confusing labels before full production.

Go to Top